Fibonacci retracements are a popular tool in technical analysis, enabling traders to forecast potential price reversals and identify critical support and resistance levels. Named after the Italian mathematician Leonardo Fibonacci, these retracements are based on a series of numbers where each number is the sum of the two preceding ones. This sequence creates specific ratios, which traders use to gauge possible price corrections during market movements.
The primary Fibonacci ratios—23.6%, 38.2%, 50%, 61.8%, and 100%—serve as key levels where traders expect price action to pause or reverse. For instance, after a significant price increase, traders might look for a pullback at the 61.8% retracement level, where buyers could step in again. Conversely, during a downtrend, the 38.2% level might present a resistance point where sellers re-enter the market.
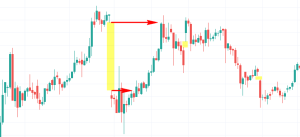
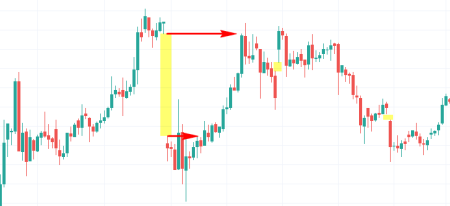
In practice, incorporating Fibonacci retracements into trading strategies involves drawing horizontal lines across the chart at these key levels. This visual representation helps traders make informed decisions about entry and exit points. However, while Fibonacci retracements can provide valuable insights, they are best used in conjunction with other technical indicators and market analysis tools to improve accuracy and reliability.
Ultimately, mastering Fibonacci retracements requires practice and experience, but their mathematical precision offers traders a structured approach to navigating the complexities of market behavior.


