How to Read a Crypto Chart (Technical Analysis Basics) | BPAYNEWS Learn
How to Read a Crypto Chart (Technical Analysis Basics)
Chart reading is an essential skill for traders and investors. Learn how to interpret candlesticks, spot trends, and use key indicators effectively.
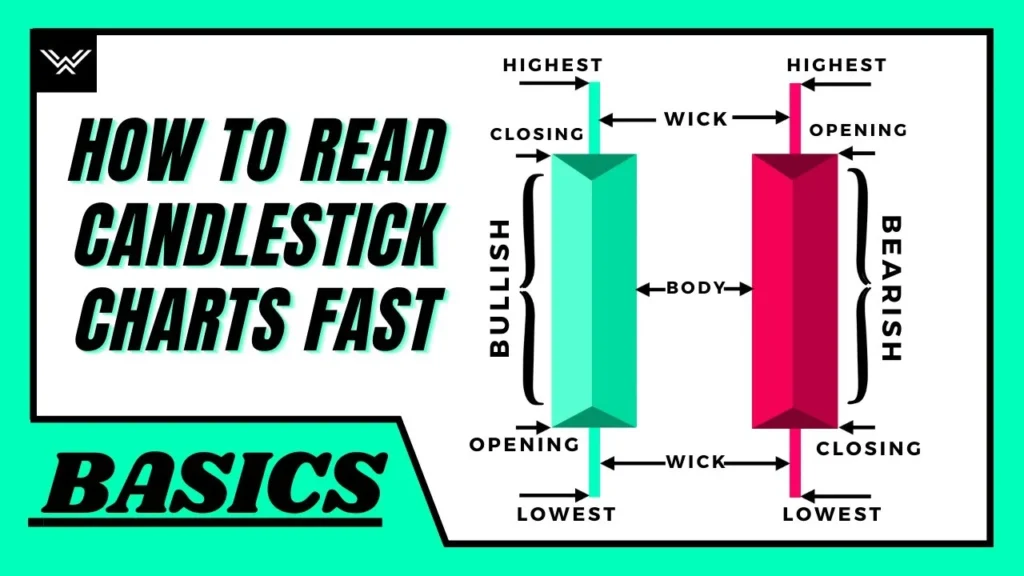
Understand Candlesticks
- Green candle: Close higher than open (bullish).
- Red candle: Close lower than open (bearish).
- Wicks: Show price rejection zones.
Identify Key Levels
- Support: Price zone where buyers step in.
- Resistance: Price zone where sellers dominate.
Popular Indicators
- Moving Averages (MA): Identify trends and momentum.
- RSI: Spot overbought/oversold zones.
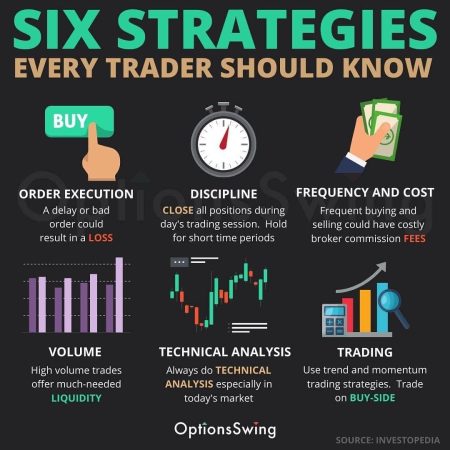
- Volume: Confirm breakouts and reversals.
Tips for Beginners
- Focus on higher timeframes (4H, 1D) for clarity.
- Avoid overloading charts with too many indicators.
- Backtest your strategy with past data.
You May Also Like
Written by BPAYNEWS Learn | Category: Trading / How-To


